A benchmark feature was planned very early in the development process of the Universal Chip Analyzer. Given the vast differences in microarchitecture between a 486 and an 8080, two benchmarks are necessary: one to compare older 8-bit CPUs from various manufacturers with incompatible instruction sets (Motorola 6800, Intel 8080, MOS 6502, etc.), and another for 16- and 32-bit CPUs based on Intel’s x86 ISA. Let’s begin with building an Integer/FP benchmark for “modern” CPUs like the 386 or 486. (I’ll cover how to evaluate older CPUs’ performance in a later post.)
So, what is a CPU benchmark? Essentially, it’s a score derived from the ratio between a piece of code designed to emulate real-world programs (using similar sets of instructions) and the time required to execute that code. While there is no debate about how to measure time, there are endless discussions about the best instructions to use for an effective benchmark. By profiling various common programs, benchmark writers determine how instructions are statistically used and then create synthetic code that mimics a similar instruction distribution.
Let’s see if and how this approach can apply to the UCA.
INT Performance Benchmark
In the 80s and 90s, the industry-standard for measuring integer performance was the “Dhrystone” benchmark, originally published in 1984 in Ada by Reinhold P. Weicker and later ported to C by Rick Richardson. Dhrystone was designed to evaluate overall system performance with a focus on integer operations, as floating-point instructions were rare at that time. The real-world programs used by Weicker to define the instruction distribution for Dhrystone were written in Fortran, Pascal, and long-obsolete languages like ALGOL. A complete description of the instruction statistics behind the C version of Dhrystone can be found in the dhry.h header file.
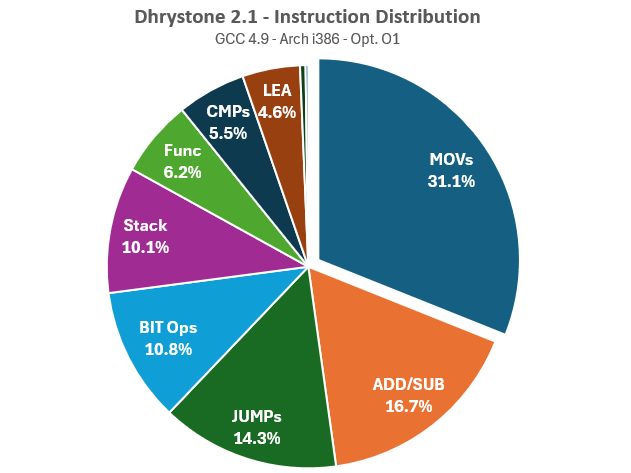
To implement a similar code in the Universal Chip Analyzer, I first needed to understand exactly what Dhrystone does. I began by compiling the original C code using GCC 4.9, targeting the “i386” architecture with the “-O1” optimization flag to avoid extreme optimization. Then, I used Intel’s Pin Architecture Analysis tool to log every instruction executed by the Dhrystone binary and sorted them. Finally, I grouped the instructions by family.
Key findings include:
-
-
- MOV Instructions: About 30% of executed instructions are MOVs. Of these, 68.8% are used to read memory, 22.7% to write to memory (the usual 2:1 ratio), and 8.5% involve registers only.
- Integer Operations: Integer ADDs account for 13.7% of total instructions executed, while Integer SUBs account for 3.1%.
- Bit Operations: Bit operations (Boolean manipulation, shift, rotate, etc.) account for approximately 11% of total instructions, and bit-based comparisons account for 5.5%.
- String Operations: About 20% of MOVs instructions are related to string operation (like movsd)
- LEA Instructions: LEA instructions, a compiler trick to optimize basic arithmetic operations using a memory computation-related instruction, remain below 5%.
- Program Flow Control: JUMPs are mainly conditional, with 70% being jnz (Jump if not zero). Stack operations (push/pop) and function control (call/ret) account for 16.3% of the total instructions.
-
As an arithmetic benchmark, Dhrystone also performs some multiplication (0.2% of the total) and division (also 0.2%). While this 0.4% may seem insignificant compared to the 16.7% for addition and subtraction, it’s important to understand that ADD and SUB instructions require only 2 cycles on an i486, while IDIV and IMULT instructions can require up to 43 cycles, making them 20 times slower. Consequently, these 0.4% of div/mult operations take as much time as 50% of all add/sub operations. This must be considered to avoid an issue where a single time-consuming instruction skews the final score.
Another crucial point is related to the memory access subsystem (including the cache, when available). A benchmark like Dhrystone doesn’t solely evaluate CPU performance, but rather how the CPU and memory perform together. To what extent? The instruction statistics show that approximately 30% of executed instructions reference a memory location, resulting in a read/write operation. With the slow memory used in the 1980s and 1990s, the final score could be directly linked to the performance of the memory (or the memory controller, or the internal cache). Should this be simulated by the UCA, given that the memory simulated by the UCA is extremely fast with zero wait state? I don’t think so. The goal here is to design a pure CPU benchmark, as independent of memory subsystem speed as possible. Nonetheless, some memory operations are still necessary to consider the latency and bandwidth of very common instructions referencing memory like MOVs.
With these results in mind, and taking into consideration the number of cycles required for instructions on CPUs ranging from the 8086 to the 80486, here is the instruction dispatch I selected for the Integer benchmark of the Universal Chip Analyzer:
-
-
- 25% MOVs: 10% Direct (Reg/Reg), 10% Read (Reg/Mem), 5% Write (Mem/Reg)
- 16% ADDs + 8% SUB: Basic arithmetic operation.
- 5% MULT + 0.25% DIV: Same execution time than the 24% ADD/SUB
- 12% Boolean operation: AND, OR, XOR, INC, DEC, …
- 6% Rotation/Shift: ROR, ROL, SHL, SHR, …
- 10% conditional JUMPs: JNZ, JZ, JNE, JE, …
- ~20% for Flow control and stack management: PUSH, POP, CALL, RET, …
-
Of course, this code can be changed easily at any time to fit specific benchmarking needs.
FP Performance Benchmark
When considering floating-point benchmarks, the two clear choices were Whetstone and Linpack. I profiled both using various tools. Let’s begin with Linpack to understand why I ultimately preferred Whetstone.
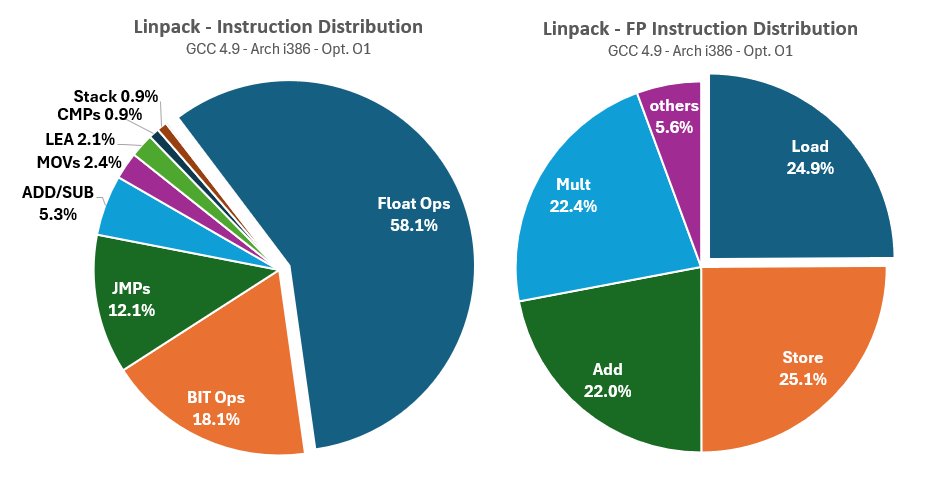 As shown in the instruction statistics charts, the authors of Linpack recognized early on that the FMA (Floating-point Multiply-Add) would become the cornerstone of intensive compute activities for decades to come. Consequently, they fine-tuned Linpack to focus almost exclusively on FMA operations.
Linpack exhibits very few memory dependencies (less than 3%) and even fewer control flow and stack instructions (less than 2%), which could be great for the UCA. However, the floating-point instruction dispatch reveals that only four FP instructions are predominantly used: FADD, FMULT, and FLD/FSTP for loading static values and storing results in registers. Linpack essentially measures the FMA performance of an FP execution unit, which is insufficient for properly evaluating an entire FPU.
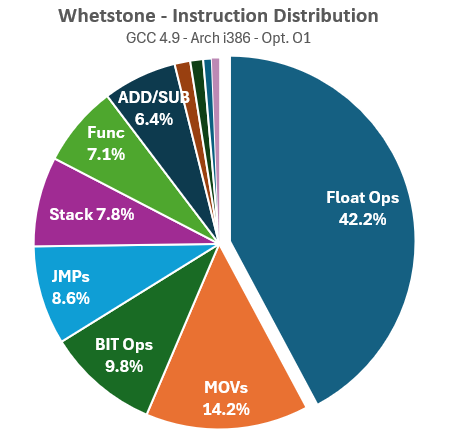
Now let’s profile Whetstone the same way, stating with all-instructions statistics:
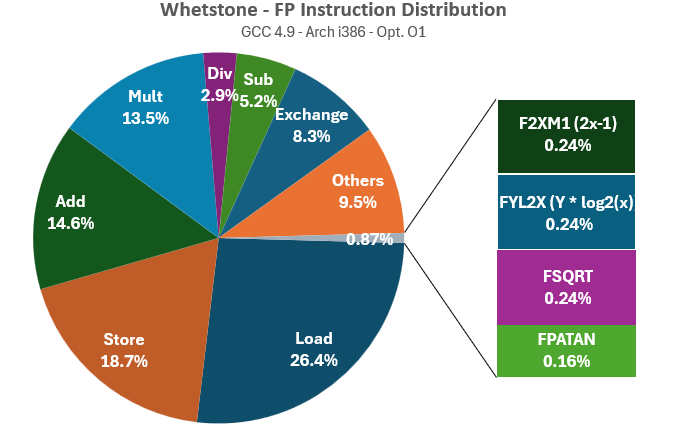
Whetstone demonstrates a more balanced use of non-FP instructions, though this comes at the expense of a lower volume of FP instructions overall. Memory dependencies, stack usage, and function control are significantly higher compared to Linpack. Next, let’s examine the distribution of FP instructions:
Whetstone utilizes the complete set of instructions available on early x87 FPUs, maintaining a balance between very fast instructions like FADD and much slower functions like FSQRT (square root), as well as even more time-consuming logarithmic, exponential, or trigonometric instructions like FPATAN, FSIN, or FCOS (which can take hundreds of cycles on any 386 or 486!). This comprehensive range is exactly what we need for a thorough evaluation of FPU performance.
To summarize, for the Universal Chip Analyzer FP benchmark, we need the non-FP instruction dispatch statistics of Linpack (with very few memory dependencies and minimal stack/program control flow instructions) combined with the variety of FP operations found in Whetstone (not just FMA but the full suite of FP operations, from square roots to trigonometric functions). Of course, we must balance these instructions to ensure no single operation disproportionately affects the overall performance.
Here is my proposed dispatch that will be implemented as “V1” of the UCA FP Benchmark:
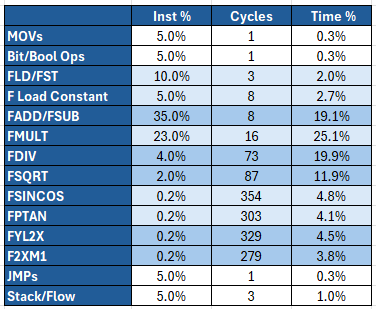 FMAs account for 45% of the total execution time, FDIV/FSQRT for 30% and log/exp/trigonometric functions for 17%. Memory dependencies are reduced to the bare minimum, as well as others program control flow instructions including stack operations.
Now it’s time to implement this!
Related Sources:
1. An overview of common benchmarks by R. Weicker
2. Benchmark Programs and Reports
3. 80×86 Integer Instruction Set (8088 – Pentium)
4. 80×87 Instruction Set (x87 – Pentium)


